| |||||||||||||||||||||||||||||||||||||
All 110 seats in the Michigan House of Representatives 56 seats needed for a majority | |||||||||||||||||||||||||||||||||||||
|---|---|---|---|---|---|---|---|---|---|---|---|---|---|---|---|---|---|---|---|---|---|---|---|---|---|---|---|---|---|---|---|---|---|---|---|---|---|
| Turnout | 4,424,051 (59.34%) | ||||||||||||||||||||||||||||||||||||
| |||||||||||||||||||||||||||||||||||||
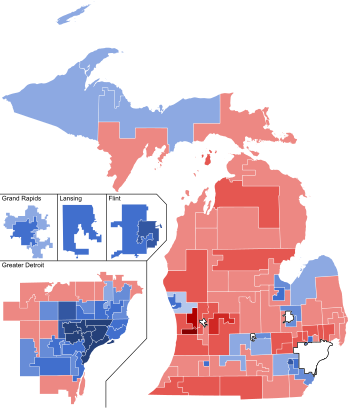
Democratic gain Republican gain Democratic hold Republican hold Republican: 50–60% 60–70% 70–80% 80–90% >90% Democratic: 40–50% 50–60% 60–70% 70–80% 80–90% >90% | |||||||||||||||||||||||||||||||||||||
| |||||||||||||||||||||||||||||||||||||
| Elections in Michigan |
|---|
 |
The 2012 Michigan House of Representatives elections were held on November 6, 2012, with partisan primaries to select the parties' nominees in the various districts on August 7, 2012. The Republican Party retained its majority in the House of Representatives despite losing the popular vote.


