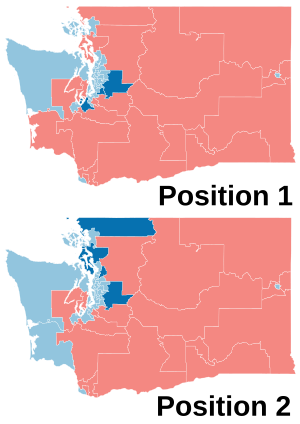
| ||||||||||||||||||||||||||||||||||
All 98 seats in the Washington House of Representatives 50 seats needed for a majority | ||||||||||||||||||||||||||||||||||
|---|---|---|---|---|---|---|---|---|---|---|---|---|---|---|---|---|---|---|---|---|---|---|---|---|---|---|---|---|---|---|---|---|---|---|
| ||||||||||||||||||||||||||||||||||
 Results: Democratic gain Democratic hold Republican hold | ||||||||||||||||||||||||||||||||||
| ||||||||||||||||||||||||||||||||||
| Elections in Washington |
|---|
 |
The 2018 Washington House of Representatives elections took place as part of the biennial United States elections. Washington state voters elected state representatives in all 98 seats of the House, electing 2 state representatives in each of the 49 Washington state legislative districts. State representatives serve two-year terms in the Washington House of Representatives. A statewide map of Washington's state legislative districts is provided by the Washington State Legislature here, Archived 2018-10-24 at the Wayback Machine.
A top two primary election on August 7, 2018, determined which candidates appeared on the November 6 general election ballot. Each candidate is allowed to write in their party preference so that it appears as they desire on the ballot.[1]
Democrats increased their 50–48 majority in the 2016 elections by flipping seven seats to hold 57 seats to Republicans' 41.
Only three districts, the 10th, 19th, and 42nd, elected their two representatives from different parties.

