This article includes a list of general references, but it lacks sufficient corresponding inline citations. (February 2012) |


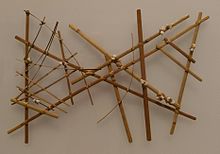
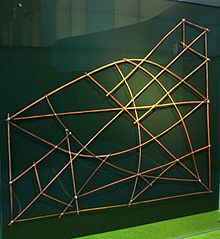
Stick charts were made and used by the Marshallese to navigate the Pacific Ocean by canoe off the coast of the Marshall Islands. The charts represented major ocean swell patterns and the ways the islands disrupted those patterns, typically determined by sensing disruptions in ocean swells by islanders during sea navigation.[1]
Most stick charts were made from the midribs of coconut fronds that were tied together to form an open framework. Island locations were represented by shells tied to the framework, or by the lashed junction of two or more sticks. The threads represented prevailing ocean surface wave-crests and directions they took as they approached islands and met other similar wave-crests formed by the ebb and flow of breakers. Individual charts varied so much in form and interpretation that the individual navigator who made the chart was the only person who could fully interpret and use it. The use of stick charts ended after World War II when new electronic technologies made navigation more accessible and travel among islands by canoe lessened.
- ^ Asscher 2002