
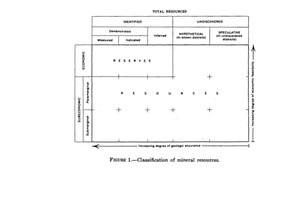
A McKelvey diagram or McKelvey box is a visual representation used to describe a natural resource such as a mineral or fossil fuel, based on the geologic certainty of its presence and its economic potential for recovery. The diagram is used to estimate the uncertainty and risk associated with availability of a natural resource.[3][4][5] As geological assurance of a resource's occurrence decreases, risk increases. As economic recoverability of a resource decreases, risk also increases.[3][2]
- ^ Brobst, Donald A.; Pratt, Walden P.; McKelvey, V. E. (1973). Summary of United States mineral resources (PDF). Washington: United States Department of the Interior, Geological Survey. p. 4. Retrieved 2 September 2021.
- ^ a b Kleppe, Thomas S.; McKelvey, V. E. (1976). Principles of the mineral resource classification system of the U.S. Bureau of Mines and U.S. Geological Survey : Geological Survey Bulletin 1450-A (PDF). Washington, D.C.: United States Government Printing Office. p. A2. Retrieved 2 September 2021.
- ^ a b Cite error: The named reference
Rognerwas invoked but never defined (see the help page). - ^ Cite error: The named reference
Grenonwas invoked but never defined (see the help page). - ^ Sheldon, R. P. (1976). "Estimates of undiscovered petroleum resources--A perspective". U. S. Geol . Survey Annual Report Fiscal Year 1975. Washington, D. C.: U.S. Department of the Interior. pp. 11–21. Retrieved 3 September 2021.