In mechanics, the derivative of the position vs. time graph of an object is equal to the velocity of the object. In the International System of Units, the position of the moving object is measured in meters relative to the origin, while the time is measured in seconds. Placing position on the y-axis and time on the x-axis, the slope of the curve is given by:
Here is the position of the object, and is the time. Therefore, the slope of the curve gives the change in position divided by the change in time, which is the definition of the average velocity for that interval of time on the graph. If this interval is made to be infinitesimally small, such that becomes and becomes , the result is the instantaneous velocity at time , or the derivative of the position with respect to time.
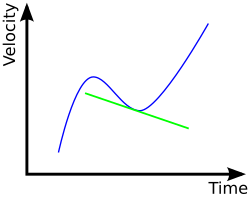
A similar fact also holds true for the velocity vs. time graph. The slope of a velocity vs. time graph is acceleration, this time, placing velocity on the y-axis and time on the x-axis. Again the slope of a line is change in over change in :
where is the velocity, and is the time. This slope therefore defines the average acceleration over the interval, and reducing the interval infinitesimally gives , the instantaneous acceleration at time , or the derivative of the velocity with respect to time (or the second derivative of the position with respect to time). In SI, this slope or derivative is expressed in the units of meters per second per second (, usually termed "meters per second-squared").
Since the velocity of the object is the derivative of the position graph, the area under the line in the velocity vs. time graph is the displacement of the object. (Velocity is on the y-axis and time on the x-axis. Multiplying the velocity by the time, the time cancels out, and only displacement remains.)
The same multiplication rule holds true for acceleration vs. time graphs. When acceleration is multiplied


