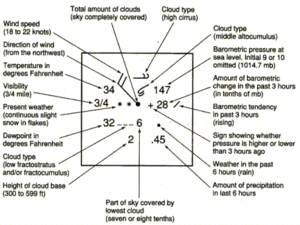
In meteorology, station models are symbolic illustrations showing the weather occurring at a given reporting station. Meteorologists created the station model to fit a number of weather elements into a small space on weather maps. This allows map users to analyze patterns in atmospheric pressure, temperature, wind speed and direction, cloud cover, precipitation, and other parameters.[1] The most common station plots depict surface weather observations although upper air plots at various mandatory levels are also frequently depicted.
Station model plots use an internationally accepted coding convention that has changed little since August 1, 1941. Elements in the plot show the key weather elements, including temperature, dew point, wind, cloud cover, air pressure, pressure tendency, and precipitation.[2][3]
- ^ CoCoRAHS (2015).INTRODUCTION TO DRAWING ISOPLETHS. Archived 2007-04-28 at the Wayback Machine Colorado Climate Center. Retrieved on 2007-04-29.
- ^ National Weather Service (2003). Station Model Example. Retrieved on 2007-04-29.
- ^ Dr Elizabeth R. Tuttle (2005). Weather Maps. Archived 2008-07-09 at the Wayback Machine J. B. Calvert. Retrieved on 2007-05-10.