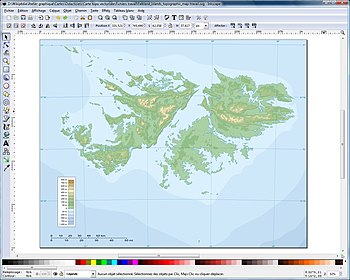
The aim of this tutorial is to show how to create a vector graphics topographic map from DEMs resulting from NASA's Shuttle Radar Topography Mission (SRTM) by using the GIS programs 3DEM andGRASS GIS.

There are several advantages in using DEMs from the SRTM in that the data are free (in the public domain), are freely accessible on NASA's website, are precise (to a resolution of 31 m at the equator), cover practically all inhabited land surfaces (80% of emerged terrain), and come from a reliable source. There is also less chance of making an error in, for example, a contour line trace than from one produced from a scanned map; digitally produced maps are easier to make than hand-drawn ones, and above all for the ends of Wikipedia, the data are instantly accessible to all, saving a huge amount of time in documentary research for freely reusable sources. It is also worth noticing that the maps are in "SVG" format, (except for relief shading images), which can be used at any size without loss of quality.
Those interested in a map produced more simply and in bitmap format can consult the bitmap relief map creation tutorial.
GRASS GIS does not allow the re-projection of a map "on the fly": each map project is precisely defined from its creation (geographical localisation, resolution, projection etc) and may not be modified afterwards. On the other hand it is not possible to import a DEM into a project if the projections are not the same, which obliges us to first create a project using the native projection of the DEM and then a second in the projection which will be used during the final map.
The creation of this type of map is comprised of various stages, but the process is quite simple:
- Fusion of the DEMs and filling in of voids[1] in 3DEM;
- Creation of a project using the native projection of the DEMs and importation of the map into GRASS;
- Creation of a second project using a UTM projection and re-projection of the map;
- Extraction of the altitude segments;
- Vectorisation of each segment of altitude in Inkscape;
- Importation of the coastal map;
- Reframing of the map;
- Colorisation of each level;
- Creation and integration of the map of optimized relief shading;
- Creation and integration of the bathymetry map;
- Finalisation of the map with the latitude and longitude grids and scales.

In addition, this page also shows how to modify the resulting map to produce a thematic topographical map.
- ^ One of the problems with SRTM files is that, in spite of the fact that practically all emerged terrain has been overflown at least twice, certain zones have remained hidden from the oblique radar ray due to the sharply accidented relief, giving rise to voids in the map information.