| |||||||||||||||||||||||||||||||||
All 39 non-metropolitan counties, 1 sui generis authority, all 26 Northern Irish districts and all 8 Welsh counties | |||||||||||||||||||||||||||||||||
|---|---|---|---|---|---|---|---|---|---|---|---|---|---|---|---|---|---|---|---|---|---|---|---|---|---|---|---|---|---|---|---|---|---|
| |||||||||||||||||||||||||||||||||
 Colours denote the winning party, as shown in the main table of results. | |||||||||||||||||||||||||||||||||
The 1985 United Kingdom local elections were held on Thursday 2 May 1985 in England and Wales, and Wednesday 15 May 1985 in Northern Ireland.[1][2][3][4] Labour had the largest share of the vote in local council elections for the first time since 1981.
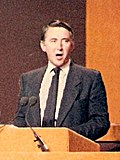
Both Conservatives and Labour lost some seats to the Liberal-SDP Alliance, who were rebuilding under the leadership of David Owen and enjoying strong showings — including a brief lead — in the opinion polls.
- ^ Rallings, Colin; Thrasher, Michael. Local Elections Handbook 1985, Volume 1. The Elections Centre. Retrieved 3 May 2016.
- ^ Rallings, Colin; Thrasher, Michael. Local Elections Handbook 1985, Volume 2. The Elections Centre. Retrieved 3 May 2016.
- ^ Rallings, Colin; Thrasher, Michael. Local Elections Handbook 1985, Volume 3. The Elections Centre. Retrieved 3 May 2016.
- ^ "Council compositions". The Elections Centre. Retrieved 3 May 2016.


