This article has multiple issues. Please help improve it or discuss these issues on the talk page. (Learn how and when to remove these messages)
|


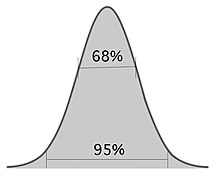
Informally, in frequentist statistics, a confidence interval (CI) is an interval which is expected to typically contain the parameter being estimated. More specifically, given a confidence level (95% and 99% are typical values), a CI is a random interval which contains the parameter being estimated % of the time.[1][2] The confidence level, degree of confidence or confidence coefficient represents the long-run proportion of CIs (at the given confidence level) that theoretically contain the true value of the parameter; this is tantamount to the nominal coverage probability. For example, out of all intervals computed at the 95% level, 95% of them should contain the parameter's true value.[3]
Factors affecting the width of the CI include the sample size, the variability in the sample, and the confidence level.[4] All else being the same, a larger sample produces a narrower confidence interval, greater variability in the sample produces a wider confidence interval, and a higher confidence level produces a wider confidence interval.[5]
- ^ Zar, Jerrold H. (199). Biostatistical Analysis (4th ed.). Upper Saddle River, N.J.: Prentice Hall. pp. 43–45. ISBN 978-0130815422. OCLC 39498633.
- ^ Dekking, Frederik Michel; Kraaikamp, Cornelis; Lopuhaä, Hendrik Paul; Meester, Ludolf Erwin (2005). "A Modern Introduction to Probability and Statistics". Springer Texts in Statistics. doi:10.1007/1-84628-168-7. ISBN 978-1-85233-896-1. ISSN 1431-875X.
- ^ Illowsky, Barbara. Introductory statistics. Dean, Susan L., 1945-, Illowsky, Barbara., OpenStax College. Houston, Texas. ISBN 978-1-947172-05-0. OCLC 899241574.
- ^ Hazra, Avijit (October 2017). "Using the confidence interval confidently". Journal of Thoracic Disease. 9 (10): 4125–4130. doi:10.21037/jtd.2017.09.14. ISSN 2072-1439. PMC 5723800. PMID 29268424.
- ^ Khare, Vikas; Nema, Savita; Baredar, Prashant (2020). Ocean Energy Modeling and Simulation with Big Data Computational Intelligence for System Optimization and Grid Integration. Butterworth-Heinemann. ISBN 978-0-12-818905-4. OCLC 1153294021.
