| Demographics of Eswatini | |
|---|---|
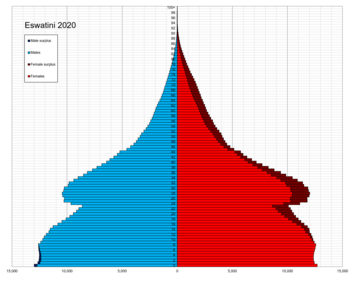
 Population pyramid of Eswatini in 2020 | |
| Population | 1,121,761 (2022 est.) |
| Growth rate | 0.75% (2022 est.) |
| Birth rate | 23.35 births/1,000 population (2022 est.) |
| Death rate | 9.71 deaths/1,000 population (2022 est.) |
| Life expectancy | 59.69 years |
| • male | 57.62 years |
| • female | 61.81 years |
| Fertility rate | 2.44 children born/woman (2022 est.) |
| Infant mortality rate | 39.63 deaths/1,000 live births |
| Net migration rate | -6.16 migrant(s)/1,000 population (2022 est.) |
| Age structure | |
| 0–14 years | 33.63% |
| 65 and over | 3.83% |
| Sex ratio | |
| Total | 0.9 male(s)/female (2022 est.) |
| At birth | 1.03 male(s)/female |
| Under 15 | 1 male(s)/female |
| 65 and over | 0.48 male(s)/female |
| Nationality | |
| Nationality | Swati |
| Language | |
| Official | English, siSwati |
Demographic features of the population of Eswatini include population density, ethnicity, education level, health of the populace, economic status, religious affiliations and other aspects of the population.

The majority of Eswatini's population is ethnic Swazi, mixed with a small number of Zulus and white Africans, predominantly of British and Afrikaner origin. This population also includes a small segment within it that is mixed with any number of these ancestries.
Traditionally Swazis have been subsistence farmers and herders, but most now work in the growing urban formal economy and in government. Some Swazis work in the mines in South Africa. Eswatini also received Portuguese settlers and black refugees from Mozambique. Christianity in Eswatini is sometimes mixed with traditional beliefs and practices. Most Swazis ascribe a special spiritual role to the Swazi Royal Family.
The country's official languages are Siswati (a language related to Zulu) and English. Government and commercial business is conducted mainly in English. Asians, Afrikaners, Portuguese, and black Mozambicans speak their own languages.