| Demographics of Guam | |
|---|---|
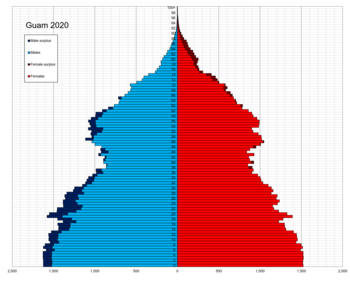
 Population pyramid of Guam in 2020 | |
| Population | 169,086 (2022 est.) |
| Growth rate | 0.16% (2022 est.) |
| Birth rate | 18.56 births/1,000 population (2022 est.) |
| Death rate | 6.03 deaths/1,000 population (2022 est.) |
| Life expectancy | 77.5 years |
| • male | 75.07 years |
| • female | 80.08 years |
| Fertility rate | 2.78 children born/woman (2022 est.) |
| Infant mortality rate | 11.46 deaths/1,000 live births |
| Net migration rate | -10.96 migrant(s)/1,000 population (2022 est.) |
| Age structure | |
| 0–14 years | 27.22% |
| 65 and over | 9.54% |
| Sex ratio | |
| Total | 1.06 male(s)/female (2022 est.) |
| At birth | 1.07 male(s)/female |
| Under 15 | 1.07 male(s)/female |
| 65 and over | 0.71 male(s)/female |
| Nationality | |
| Nationality | Guamanian (US Citizens) |
The demographics of Guam details an array of demographic statistics relating to the territory of Guam. This includes statistics on population, including the Indigenous population; religious affiliations; language; and immigration. The Demographics of Guam provides an overview of the history of Guam, as well as a depiction of the villages in the United States territory and its populace. The population of Guam, as of July 2021 was 168,801.[1]
The demographics of Guam include the demographic features of the population of Guam, including population density, ethnicity, education level, health of the populace, economic status, religious affiliations and other aspects of the population.
- ^ "Guam – The World Factbook". cia.gov. Retrieved 19 May 2021.