| Demographics of Paraguay | |
|---|---|
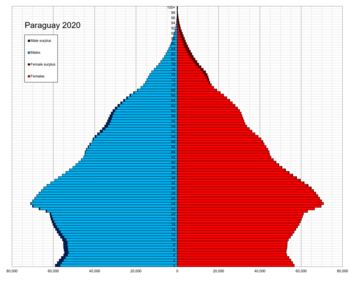
 Population pyramid of Paraguay in 2020 | |
| Population | 6,109,644 (2022 census)[1] |
| Growth rate | 0.89% (2022 census) |
| Birth rate | 16.32 births/1,000 population (2022 est.) |
| Death rate | 4.87 deaths/1,000 population (2022 est.) |
| Life expectancy | 78.37 years |
| Fertility rate | 2.4 children born/woman (2022 census) |
| Infant mortality rate | 23.21 deaths/1,000 live births |
| Net migration rate | -0.07 migrant(s)/1,000 population (2022 est.) |
| Age structure | |
| 0–14 years | 24.3% |
| 15–64 years | 66.9% |
| 65 and over | 8.8% |
| Nationality | |
| Nationality | Paraguayan |
| Major ethnic |
|
| Minor ethnic |
|
| Language | |
| Official | Spanish and Guarani |
| Spoken | Languages of Paraguay |
| Year | Pop. | ±% |
|---|---|---|
| 1950 | 1,328,452 | — |
| 1962 | 1,819,103 | +36.9% |
| 1972 | 2,357,955 | +29.6% |
| 1982 | 3,029,830 | +28.5% |
| 1992 | 4,152,588 | +37.1% |
| 2002 | 5,163,198 | +24.3% |
| 2012 | 6,461,041 | +25.1% |
| 2022 | 6,109,644 | −5.4% |
| Source:[4] | ||
Demographic features of the population of Paraguay include population density, ethnicity, education level, health of the populace, economic status, religious affiliations and other aspects of the population.
- ^ "Paraguay has 6,109,644 inhabitants, according to the last Census". ABC Color (in Spanish). 31 August 2023.
- ^ "Censo Indígena 2022 - INE" (PDF). Instituto Nacional de Estadística - Paraguay. Retrieved 9 September 2023.
- ^ "Editorial".
- ^ "Evolución de la Población Total". DGEEC. Retrieved 27 July 2017.