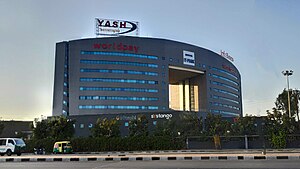
 IT Park, Indore | |
| 1 April – 31 March | |
| Statistics | |
| GDP | ₹15.22 lakh crore (US$182 billion) (2024-25 est.)[1] |
| GDP rank | 10th |
GDP per capita | ₹156,381 (US$1,874) (2023-24)[2] |
GDP per capita rank | 25th |
GDP by sector | Agriculture 47% Industry 19% Services 34% (2020-21)[3] |
Population below poverty line | 20.63%[4] |
Labour force by occupation | Agriculture 62% Industry 5% Services 33% (2015)[5] |
| Unemployment | |
| Public finances | |
| 33.31% of GSDP (2022-23 est.)[3] | |
| ₹−62,564 crore (US$−7.5 billion) 4.11% of GSDP (2024-25 est.)[7] | |
| Revenues | ₹2.63 lakh crore (US$32 billion) (2024-25 est.)[8] |
| Expenses | ₹3.26 lakh crore (US$39 billion) (2024-25 est.)[9] |
All values, unless otherwise stated, are in US dollars. | |
The Economy of Madhya Pradesh refers to the economic growth with respect to the Indian state of Madhya Pradesh. It grew 12% in GDP for the year of 2011–12, for which it received an award from the President Pranab Mukherjee in January 2013 for improving its tourism, medical and infrastructural growth. The economy of Madhya Pradesh is significantly agrarian which is reflecting rapid strides towards industrial and service sectors as well. The Indore, Bhopal and Jabalpur districts are the top 3 districts in terms of highest output generation in the state's economy.[10]
- ^ Legislative Research, PRS. "Madhya Pradesh Budget Analysis 2024-25" (PDF). PRS India. PRS Legislative Research. Retrieved 14 September 2024.
- ^ Legislative Research, PRS. "Madhya Pradesh Budget Analysis 2024-25" (PDF). PRS India. PRS Legislative Research. Retrieved 14 September 2024.
- ^ a b "Madhya Pradesh Budget Analysis 2022-23". PRS Legislative Research. Retrieved 12 March 2022.
- ^ "Data: Less Than 10% Population Multidimensionally Poor in 14 States". FACTLY. 24 July 2023. Retrieved 26 July 2023.
- ^ "Madhya Pradesh Budget Analysis 2016-17" (PDF). PRS Legislative Research. Archived from the original (PDF) on 15 February 2017. Retrieved 19 November 2016.
- ^ "Unemployment Rate in India". Centre for Monitoring Indian Economy. p. 1. Retrieved 3 November 2020.
- ^ Legislative Research, PRS. "Madhya Pradesh Budget Analysis 2024-25" (PDF). PRS India. PRS Legislative Research. Retrieved 14 September 2024.
- ^ Legislative Research, PRS. "Madhya Pradesh Budget Analysis 2024-25" (PDF). PRS India. PRS Legislative Research. Retrieved 14 September 2024.
- ^ Legislative Research, PRS. "Madhya Pradesh Budget Analysis 2024-25" (PDF). PRS India. PRS Legislative Research. Retrieved 14 September 2024.
- ^ "Madhya Pradesh Presentation And Economy Growth Report" (PDF). India Brand Equity Foundation. IBEF. Retrieved 19 September 2021.