This article needs to be updated. (March 2022) |
 | |
| Currency | Maldivian rufiyaa (MVR, Rf) |
|---|---|
| Calendar year | |
Trade organisations | WTO, SAFTA |
Country group |
|
| Statistics | |
| GDP | |
| GDP rank | |
GDP growth |
|
GDP per capita | |
GDP per capita rank | |
GDP by sector | Agriculture (4%), industry (23%), services (73%) (2012 est.) |
| 2.3% (2022 est.)[3] | |
Population below poverty line | |
| 31.3 medium (2016)[7] | |
Labour force | |
Main industries | Fish processing, tourism, shipping, boat building, coconut processing, garments, woven mats, rope, handicrafts, sand mining |
| External | |
| Exports | $238 million (2021) |
Export goods | Fish |
Main export partners | |
| Imports | $2.83 billion (2021) |
Import goods | Petroleum products, ships, foodstuffs, clothing, intermediate and capital goods |
Main import partners | |
Gross external debt | $742 million (2014 est.) |
| Public finances | |
| $316 million (2004 est.) | |
| Revenues | $758 million (2010 est.) |
| Expenses | $362 million; including capital expenditures of $80 million (2004 est.) |
| Economic aid | N/A |
| $540 million (September 2016 est.) | |
All values, unless otherwise stated, are in US dollars. | |
In ancient times, Maldives were renowned for cowries, coir rope, dried tuna fish (Maldive fish), ambergris (maavaharu) and coco de mer (tavakkaashi). Local and foreign trading ships used to load these products in the Maldives and bring them abroad.
Nowadays, the mixed economy of Maldives is based on the principal activities of tourism, fishing and shipping. This results from the Maldives' strategic geographic positioning near crucial sea routes essential for China's energy provisions. Consequently, China has persistently utilized its economic resources to enhance its sway over the Maldivian government.
Tourism is the largest industry in the Maldives, accounting for 28% of GDP and more than 60% of the Maldives' foreign exchange receipts. It powered the current GDP per capita[13] to expand 265% in the 1980s and a further 115% in the 1990s. Over 90% of government tax revenue flows in from import duties and tourism-related taxes.
Fishing is the second leading sector in the Maldives. The economic reform program by the government in 1989 lifted import quotas and opened some exports to the private sector. Subsequently, it has liberalized regulations to allow more foreign investment.
Agriculture and manufacturing play a minor role in the economy, constrained by the limited availability of cultivable land and shortage of domestic labour. Most staple foods are imported.
Industry in the Maldives consists mainly of garment production, boat building, and handicrafts. It accounts for around 18% of GDP. Maldivian authorities are concerned about the impact of erosion and possible global warming in the low-lying country.
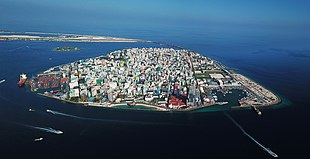
Among the 1,190 islands in the Maldives, only 198 are inhabited. The population is scattered throughout the country, and the greatest concentration is on the capital island, Malé. Limitations on potable water and arable land, plus the added difficulty of congestion are some of the problems faced by households in Malé.
Development of the infrastructure in the Maldives is mainly dependent on the tourism industry and its complementary tertiary sectors, transport, distribution, real estate, construction, and government. Taxes on the tourist industry have been plowed into infrastructure and it is used to improve technology in the agricultural sector.
- ^ "World Economic Outlook Database, April 2019". IMF.org. International Monetary Fund. Retrieved 29 September 2019.
- ^ "World Bank Country and Lending Groups". datahelpdesk.worldbank.org. World Bank. Retrieved 29 September 2019.
- ^ a b c d e "Report for Selected Countries and Subjects". IMF.org. International Monetary Fund. Retrieved 6 May 2022.
- ^ Global Economic Prospects, June 2020. World Bank. 2020. p. 98. doi:10.1596/978-1-4648-1553-9. ISBN 978-1-4648-1553-9. Retrieved 24 June 2020.
{{cite book}}:|website=ignored (help) - ^ "Poverty headcount ratio at national poverty lines (% of population) - Maldives". data.worldbank.org. World Bank. Retrieved 4 February 2020.
- ^ "Poverty headcount ratio at $5.50 a day (2011 PPP) (% of population) - Maldives". data.worldbank.org. World Bank. Retrieved 24 June 2020.
- ^ "GINI index (World Bank estimate) - Maldives". data.worldbank.org. World Bank. Retrieved 24 June 2020.
- ^ "Human Development Index (HDI)". hdr.undp.org. HDRO (Human Development Report Office) United Nations Development Programme. Retrieved 8 September 2022.
- ^ "Inequality-adjusted HDI (IHDI)". hdr.undp.org. UNDP. Retrieved 10 December 2022.
- ^ "Labor force, total - Maldives". data.worldbank.org. World Bank. Retrieved 4 February 2020.
- ^ "Employment to population ratio, 15+, total (%) (national estimate) - Maldives". data.worldbank.org. World Bank. Retrieved 4 February 2020.
- ^ a b "Export Partners of Maldives". OEC.
- ^ "GDP: GDP per capita, current US dollars". Archived from the original on 2004-09-03.