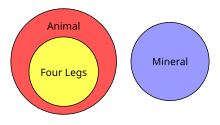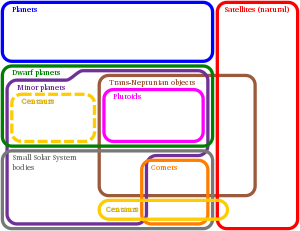

An Euler diagram (/ˈɔɪlər/, OY-lər) is a diagrammatic means of representing sets and their relationships. They are particularly useful for explaining complex hierarchies and overlapping definitions. They are similar to another set diagramming technique, Venn diagrams. Unlike Venn diagrams, which show all possible relations between different sets, the Euler diagram shows only relevant relationships.
The first use of "Eulerian circles" is commonly attributed to Swiss mathematician Leonhard Euler (1707–1783). In the United States, both Venn and Euler diagrams were incorporated as part of instruction in set theory as part of the new math movement of the 1960s. Since then, they have also been adopted by other curriculum fields such as reading[1] as well as organizations and businesses.
Euler diagrams consist of simple closed shapes in a two-dimensional plane that each depict a set or category. How or whether these shapes overlap demonstrates the relationships between the sets. Each curve divides the plane into two regions or "zones": the interior, which symbolically represents the elements of the set, and the exterior, which represents all elements that are not members of the set. Curves which do not overlap represent disjoint sets, which have no elements in common. Two curves that overlap represent sets that intersect, that have common elements; the zone inside both curves represents the set of elements common to both sets (the intersection of the sets). A curve completely within the interior of another is a subset of it.
Venn diagrams are a more restrictive form of Euler diagrams. A Venn diagram must contain all 2n logically possible zones of overlap between its n curves, representing all combinations of inclusion/exclusion of its constituent sets. Regions not part of the set are indicated by coloring them black, in contrast to Euler diagrams, where membership in the set is indicated by overlap as well as color.
- ^ "Strategies for Reading Comprehension Venn Diagrams". Archived from the original on 2009-04-29. Retrieved 2009-06-20.