This article needs additional citations for verification. (May 2015) |
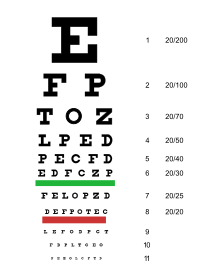
 Snellen chart used for visual testing. In this case, the chart should be 20 feet from the eyes. | |
| Uses | Vision testing |
|---|---|
| Related items | |
An eye chart is a chart used to measure visual acuity comprising lines of optotypes in ranges of sizes. Optotypes are the letters or symbols shown on an eye chart.[1] Eye charts are often used by health care professionals, such as optometrists, physicians and nurses, to screen persons for vision impairment. Ophthalmologists, physicians who specialize in the eye, also use eye charts to monitor the visual acuity of their patients in response to various therapies such as medications or surgery.
The chart is placed at a standardized distance away from the person whose vision is being tested. The person then attempts to identify the optotypes on the chart, starting with the larger ones and continuing with progressively smaller ones until the person cannot identify the optotypes. The size of the smallest optotypes that can be reliably identified is considered the person's visual acuity.
The Snellen chart is the most widely used. Alternative types of eye charts include the logMAR chart, Landolt C, E chart, Lea test, Golovin–Sivtsev table, the Rosenbaum chart, and the Jaeger chart. Eye charts do not provide doctors with information on eye diseases such as glaucoma, problems with the retina, or loss of peripheral vision.[2]
- ^ Nottingham Chaplin, P. Kay, and Geoffrey E. Bradford. "A Historical Review of Distance Vision Screening Eye Charts: What to Toss, What to Keep, and What to Replace." NASN School Nurse, vol. 26, no. 4, July 2011, pp. 221–228, doi:10.1177/1942602X11411094
- ^ Vimont, Celia. "All About the Eye Chart". American Academy of Ophthalmology. American Academy of Ophthalmology. Retrieved 6 November 2020.