This article needs additional citations for verification. (April 2018) |

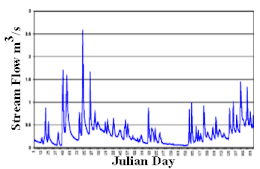
A hydrograph is a graph showing the rate of flow (discharge) versus time past a specific point in a river, channel, or conduit carrying flow. The rate of flow is typically expressed in units of cubic meters per second (m³/s) or cubic feet per second (cfs). Hydrographs often relate changes of precipitation to changes in discharge over time.[1] The term can also refer to a graph showing the volume of water reaching a particular outfall, or location in a sewerage network. Graphs are commonly used in the design of sewerage, more specifically, the design of surface water sewerage systems and combined sewers.
- ^ Sherman, LeRoy K. (1932). "The relation of hydrographs of runoff to size and character of drainage-basins". Transactions, American Geophysical Union. 13 (1): 332–339. Bibcode:1932TrAGU..13..332S. doi:10.1029/TR013i001p00332. ISSN 0002-8606.