You can help expand this article with text translated from the corresponding article in German. (February 2018) Click [show] for important translation instructions.
|

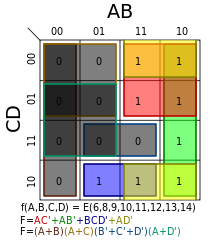
A Karnaugh map (KM or K-map) is a diagram that can be used to simplify a Boolean algebra expression. Maurice Karnaugh introduced it in 1953[1][2] as a refinement of Edward W. Veitch's 1952 Veitch chart,[3][4] which itself was a rediscovery of Allan Marquand's 1881 logical diagram[5][6] (aka. Marquand diagram[4]). It is also useful for understanding logic circuits.[4] Karnaugh maps are also known as Marquand–Veitch diagrams,[4] Svoboda charts[7] -(albeit only rarely)- and Karnaugh–Veitch maps (KV maps).
- ^ Cite error: The named reference
Karnaugh_1953was invoked but never defined (see the help page). - ^ Cite error: The named reference
Curtis_1962was invoked but never defined (see the help page). - ^ Cite error: The named reference
Veitch_1952was invoked but never defined (see the help page). - ^ a b c d Cite error: The named reference
Brown_2012was invoked but never defined (see the help page). - ^ Cite error: The named reference
Marquand_1881was invoked but never defined (see the help page). - ^ Cite error: The named reference
Gardner_1958was invoked but never defined (see the help page). - ^ Cite error: The named reference
Klir_1972was invoked but never defined (see the help page).
