This article is missing information about LGBT demographics in the U.S. territories. (September 2019) |

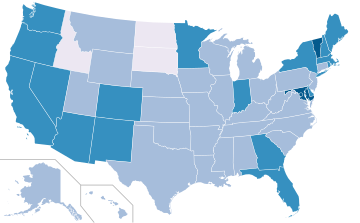
The demographics of sexual orientation and gender identity in the United States have been studied in the social sciences in recent decades. A 2022 Gallup poll concluded that 7.1% of adult Americans identified as LGBT.[1] A different survey in 2016, from the Williams Institute, estimated that 0.6% of U.S. adults identify as transgender.[2] As of 2022, estimates for the total percentage of U.S. adults that are transgender or nonbinary range from 0.5% to 1.6%.[3][4] Additionally, a Pew Research survey from 2022 found that approximately 5% of young adults in the U.S. say their gender is different from their sex assigned at birth.[5]
Studies from several nations, including the U.S., conducted at varying time periods, have produced a statistical range of 1.2[6] to 6.8[7] percent of the adult population identifying as LGBT. Online surveys tend to yield higher figures than other methods,[7] a likely result of the higher degree of anonymity of Internet surveys, and demographic of those utilizing online platforms which elicit reduced levels of socially desirable responding.[8] As of 2010[update] the U.S. Census Bureau did not ask singles about sexual orientation in the United States Census.[9] In the 2020 United States census, same-sex married couples accounted for 0.5% of all U.S. households and unmarried same-sex couples accounted for 0.4% of all U.S. households.[10]
- ^ "LGBT Identification in U.S. Ticks Up to 7.1%". Gallup. 17 Feb 2022.
- ^ Institute UCLA School of Law. "How Many Adults Identify as Transgender in the United States" (PDF).
- ^ "How Many Adults and Youth Identify as Transgender in the United States?" (PDF). June 2022.
- ^ Mitchell, Travis (2022-06-07). "The Experiences, Challenges and Hopes of Transgender and Nonbinary U.S. Adults". Pew Research Center’s Social & Demographic Trends Project. Retrieved 2023-03-08.
- ^ Brown, Anna. "About 5% of young adults in the U.S. say their gender is different from their sex assigned at birth". Pew Research Center. Retrieved 2023-03-08.
- ^ Gates, Gary J. (April 2011). "How many people are lesbian, gay, bisexual, and transgender?". Williams Institute, University of California School of Law.
- ^ a b Charlotte J. Patterson (Editor); Anthony R. D'Augelli (Editor) (2012). Handbook of Psychology and Sexual Orientation. Oxford University Press. p. 71. ISBN 978-0199765218.
{{cite book}}:|author1=has generic name (help) - ^ Peter J Aspinall (2009). Estimating the size and composition of the lesbian, gay, and bisexual population in Britain (PDF) (Report). p. 13.
The Ellison and Gunstone online survey (2009) for the Commission of over 5,000 people indicates that all methods involving interviewing in a person's home, whether face-to-face or by telephone, may incur misreporting, especially when another person is present. Respondents report that they would be least likely to conceal their sexual orientation (by switching to another sexual orientation category) when self-completion online surveys are used.
- ^ "'Queering the census' movement aims to get single gays counted". NY Daily News. 31 March 2010. Retrieved 19 March 2015.
- ^ Overberg, Paul; DeBarros, Anthony (May 25, 2023). "Same-Sex Couples Accounted for 1% of Households in 2020, Census Shows". The Wall Street Journal. News Corp. Retrieved September 5, 2023.