This article has multiple issues. Please help improve it or discuss these issues on the talk page. (Learn how and when to remove these messages)
|

A Lissajous curve /ˈlɪsəʒuː/, also known as Lissajous figure or Bowditch curve /ˈbaʊdɪtʃ/, is the graph of a system of parametric equations
which describe the superposition of two perpendicular oscillations in x and y directions of different angular frequency (a and b). The resulting family of curves was investigated by Nathaniel Bowditch in 1815, and later in more detail in 1857 by Jules Antoine Lissajous (for whom it has been named). Such motions may be considered as a particular kind of complex harmonic motion.
The appearance of the figure is sensitive to the ratio a/b. For a ratio of 1, when the frequencies match a=b, the figure is an ellipse, with special cases including circles (A = B, δ = π/2 radians) and lines (δ = 0). A small change to one of the frequencies will mean the x oscillation after one cycle will be slightly out of synchronization with the y motion and so the ellipse will fail to close and trace a curve slightly adjacent during the next orbit showing as a precession of the ellipse. The pattern closes if the frequencies are whole number ratios i.e. a/b is rational.
Another simple Lissajous figure is the parabola (b/a = 2, δ = π/4). Again a small shift of one frequency from the ratio 2 will result in the trace not closing but performing multiple loops successively shifted only closing if the ratio is rational as before. A complex dense pattern may form see below.
The visual form of such curves is often suggestive of a three-dimensional knot, and indeed many kinds of knots, including those known as Lissajous knots, project to the plane as Lissajous figures.
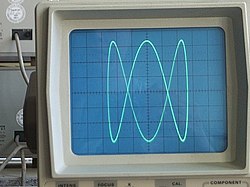
Visually, the ratio a/b determines the number of "lobes" of the figure. For example, a ratio of 3/1 or 1/3 produces a figure with three major lobes (see image). Similarly, a ratio of 5/4 produces a figure with five horizontal lobes and four vertical lobes. Rational ratios produce closed (connected) or "still" figures, while irrational ratios produce figures that appear to rotate. The ratio A/B determines the relative width-to-height ratio of the curve. For example, a ratio of 2/1 produces a figure that is twice as wide as it is high. Finally, the value of δ determines the apparent "rotation" angle of the figure, viewed as if it were actually a three-dimensional curve. For example, δ = 0 produces x and y components that are exactly in phase, so the resulting figure appears as an apparent three-dimensional figure viewed from straight on (0°). In contrast, any non-zero δ produces a figure that appears to be rotated, either as a left–right or an up–down rotation (depending on the ratio a/b).


Lissajous figures where a = 1, b = N (N is a natural number) and
are Chebyshev polynomials of the first kind of degree N. This property is exploited to produce a set of points, called Padua points, at which a function may be sampled in order to compute either a bivariate interpolation or quadrature of the function over the domain [−1,1] × [−1,1].
The relation of some Lissajous curves to Chebyshev polynomials is clearer to understand if the Lissajous curve which generates each of them is expressed using cosine functions rather than sine functions.


