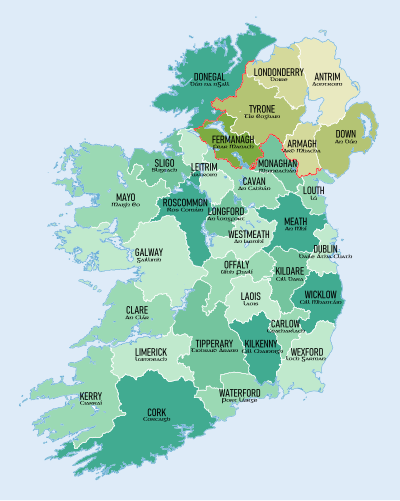
This is a list of counties of Ireland ordered by population. Counties in the Republic of Ireland are shown in normal type, while those in Northern Ireland are listed in italic type. Non-traditional administrative counties are indicated by a cream-coloured background.
For a more detailed analysis of current and historical Irish populations in the Republic of Ireland, see Irish population analysis. The population of the six counties of Northern Ireland as of 2021 is 1,903,100[1] which would mean a total population on the island of Ireland as of 2022 of approximately 7,052,314.
Data source (as of June 2023):
- Taken from latest census data for the Republic of Ireland[2] and Northern Ireland.[3]
- Population data for counties in the Republic of Ireland is based on data from the 2022 census.
- Population data for counties in Northern Ireland is based on the 2021 census.
- The previous census for the Republic of Ireland was taken in 2016, the previous census for Northern Ireland was taken in 2011.
- Density updated as of 2021 for Northern Ireland and 2022 for the Republic of Ireland.
| Rank | County | Population | Density | Province | Change since previous census |
Change per year | |
|---|---|---|---|---|---|---|---|
| per km2 | per sq mi | ||||||
| 1 | Dublin | 1,458,154 | 1,581.5 | 4,096 | Leinster | ||
| 2 | Antrim | 651,321 | 211.1 | 547 | Ulster | ||
| 3 | Cork | 584,156 | 77.5 | 201 | Munster | ||
| 4 | Down | 553,261 | 222.3 | 576 | Ulster | ||
| – | Fingal | 330,506 | 724.8 | 1,877 | Leinster | ||
| – | South Dublin | 301,705 | 1,354.5 | 3,508 | Leinster | ||
| 5 | Galway | 277,737 | 45.1 | 117 | Connacht | ||
| 6 | Londonderry | 252,231 | 119.1 | 308 | Ulster | ||
| 7 | Kildare | 247,774 | 146.2 | 379 | Leinster | ||
| – | Dún Laoghaire–Rathdown | 233,860 | 1,859.0 | 4,815 | Leinster | ||
| 8 | Meath | 220,826 | 94.3 | 244 | Leinster | ||
| 9 | Limerick | 209,536 | 76.0 | 197 | Munster | ||
| 10 | Armagh | 194,394 | 146.5 | 379 | Ulster | ||
| 11 | Tyrone | 188,383 | 57.6 | 149 | Ulster | ||
| 12 | Tipperary | 167,895 | 39.0 | 101 | Munster | ||
| 13 | Donegal | 167,084 | 34.4 | 89 | Ulster | ||
| 14 | Wexford | 163,919 | 69.3 | 179 | Leinster | ||
| 15 | Kerry | 156,458 | 32.5 | 84 | Munster | ||
| 16 | Wicklow | 155,851 | 76.9 | 199 | Leinster | ||
| 17 | Louth | 139,703 | 169.1 | 438 | Leinster | ||
| 18 | Mayo | 137,970 | 24.7 | 64 | Connacht | ||
| 19 | Clare | 127,938 | 37.1 | 96 | Munster | ||
| 20 | Waterford | 127,363 | 68.6 | 178 | Munster | ||
| 21 | Kilkenny | 104,160 | 50.2 | 130 | Leinster | ||
| 22 | Westmeath | 96,221 | 52.3 | 135 | Leinster | ||
| 23 | Laois | 91,877 | 53.4 | 138 | Leinster | ||
| 24 | Offaly | 83,150 | 41.6 | 108 | Leinster | ||
| 25 | Cavan | 81,704 | 42.3 | 110 | Ulster | ||
| 26 | Roscommon | 70,259 | 27.6 | 71 | Connacht | ||
| 27 | Sligo | 70,198 | 38.2 | 99 | Connacht | ||
| 28 | Monaghan | 65,288 | 50.4 | 131 | Ulster | ||
| 29 | Fermanagh | 63,585 | 37.6 | 97 | Ulster | ||
| 30 | Carlow | 61,968 | 69.1 | 179 | Leinster | ||
| 31 | Longford | 46,751 | 42.9 | 111 | Leinster | ||
| 32 | Leitrim | 35,199 | 21.9 | 57 | Connacht | ||
| Total | Island of Ireland | 7,052,314 | 83.5 | 216 | — | ||
| Average | 220,385 | — | — | — | — | ||
- ^ "Archived copy" (PDF). Archived from the original (PDF) on 24 December 2012. Retrieved 16 December 2014.
{{cite web}}: CS1 maint: archived copy as title (link) NISRA Key Report, 2011 - ^ "Census 2022 - Summary Results - FY003A- Population". 30 May 2023. Retrieved 3 June 2023.
- ^ "County". NISRA. Retrieved 17 August 2023.