This article needs additional citations for verification. (April 2009) |


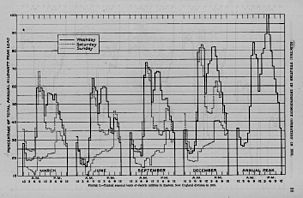
In electrical engineering, a load profile is a graph of the variation in the electrical load versus time. A load profile will vary according to customer type (typical examples include residential, commercial and industrial), temperature and holiday seasons. Power producers use this information to plan how much electricity they will need to make available at any given time. Teletraffic engineering uses a similar load curve.