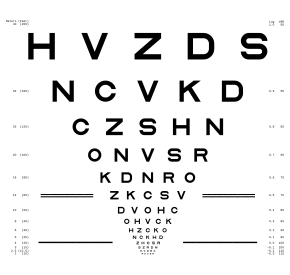
| LogMAR chart | |
|---|---|
 ETDRS Chart R, a type of logMAR chart | |
| Purpose | assess visual acuity |
A logMAR chart (Logarithm of the Minimum Angle of Resolution) is a chart consisting of rows of letters that is used by ophthalmologists, orthoptists, optometrists, and vision scientists to estimate visual acuity. The chart was developed at the National Vision Research Institute of Australia in 1976, and is designed to enable a more accurate estimate of acuity than do other charts (e.g., the Snellen chart).[1] For this reason, the LogMAR chart is recommended, particularly in a research setting.[2]
When using a LogMAR chart, visual acuity is scored with reference to the logarithm of the minimum angle of resolution, as the chart's name suggests. An observer who can resolve details as small as 1 minute of visual angle scores LogMAR 0, since the base-10 logarithm of 1 is 0; an observer who can resolve details as small as 2 minutes of visual angle (i.e., reduced acuity) scores LogMAR 0.3, since the base-10 logarithm of 2 is near-approximately 0.3; and so on.
Specific types of logMAR chart include the original Bailey-Lovie chart,[3] as well as the ETDRS charts, developed for the Early Treatment Diabetic Retinopathy Study.[4]
- ^ Bailey IL, Lovie JE. I (1976.) New design principles for visual acuity letter charts. Am J Optom Physiol Opt. 53 (11): pp. 740–745.
- ^ Grosvenor, Theodore (2007). Primary care Optometry. St. Louis, Missouri: ELSEVIER. pp. 174–175. ISBN 9780750675758.
- ^ Cite error: The named reference
url-NVRIwas invoked but never defined (see the help page). - ^ Bailey IL, Lovie JE (2013). Visual acuity testing. From the laboratory to the clinic. Vision Research 90: 2-9. doi:10.1016/j.visres.2013.05.004.