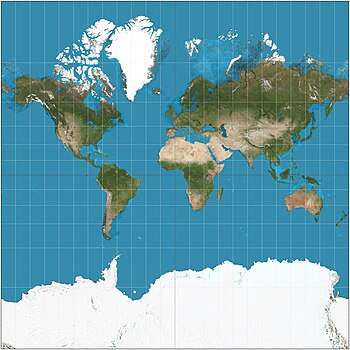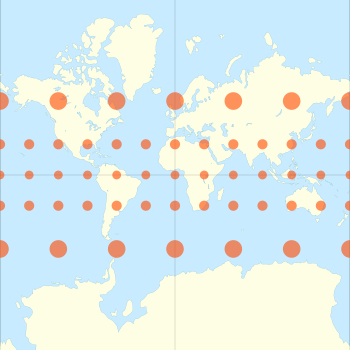


The Mercator projection (/mərˈkeɪtər/) is a conformal cylindrical map projection first presented by Flemish geographer and mapmaker Gerardus Mercator in 1569. In the 18th century, it became the standard map projection for navigation due to its property of representing rhumb lines as straight lines. When applied to world maps, the Mercator projection inflates the size of lands the further they are from the equator. Therefore, landmasses such as Greenland and Antarctica appear far larger than they actually are relative to landmasses near the equator. Nowadays the Mercator projection is widely used because, aside from marine navigation, it is well suited for internet web maps.[1]
- ^ "Gerardus Mercator". education.nationalgeographic.org. Retrieved 2024-03-02.