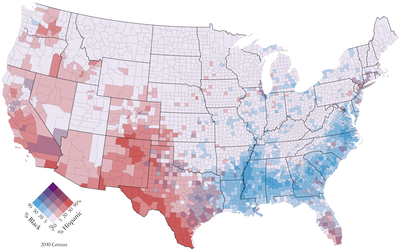
A bivariate map or multivariate map is a type of thematic map that displays two or more variables on a single map by combining different sets of symbols.[1] Each of the variables is represented using a standard thematic map technique, such as choropleth, cartogram, or proportional symbols. They may be the same type or different types, and they may be on separate layers of the map, or they may be combined into a single multivariate symbol.
The typical objective of a multivariate map is to visualize any statistical or geographic relationship between the variables. It has potential to reveal relationships between variables more effectively than a side-by-side comparison of the corresponding univariate maps, but also has the danger of Cognitive overload when the symbols and patterns are too complex to easily understand.[2]: 331
- ^ Nelson, J. (2020). Multivariate Mapping. The Geographic Information Science & Technology Body of Knowledge (1st Quarter 2020 Edition), John P. Wilson (ed.). DOI: 10.22224/gistbok/2020.1.5
- ^ T. Slocum, R. McMaster, F. Kessler, H. Howard (2009). Thematic Cartography and Geovisualization, Third Edn. Pearson Prentice Hall: Upper Saddle River, NJ.