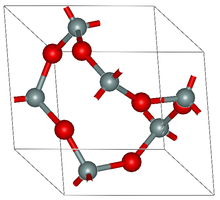

In crystallography, a periodic graph or crystal net is a three-dimensional periodic graph, i.e., a three-dimensional Euclidean graph whose vertices or nodes are points in three-dimensional Euclidean space, and whose edges (or bonds or spacers) are line segments connecting pairs of vertices, periodic in three linearly independent axial directions. There is usually an implicit assumption that the set of vertices are uniformly discrete, i.e., that there is a fixed minimum distance between any two vertices. The vertices may represent positions of atoms or complexes or clusters of atoms such as single-metal ions, molecular building blocks, or secondary building units, while each edge represents a chemical bond or a polymeric ligand.
Although the notion of a periodic graph or crystal net is ultimately mathematical (actually a crystal net is nothing but a periodic realization of an abelian covering graph over a finite graph [1]), and is closely related to that of a Tessellation of space (or honeycomb) in the theory of polytopes and similar areas, much of the contemporary effort in the area is motivated by crystal engineering and prediction (design), including metal-organic frameworks (MOFs) and zeolites.
- ^ Sunada, T. (2012), "Lecture on topological crystallography", Japan. J. Math., 7: 1–39, doi:10.1007/s11537-012-1144-4