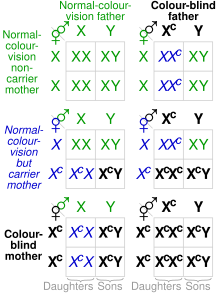

The Punnett square is a square diagram that is used to predict the genotypes of a particular cross or breeding experiment. It is named after Reginald C. Punnett, who devised the approach in 1905.[3][4][5][6][7][8] The diagram is used by biologists to determine the probability of an offspring having a particular genotype. The Punnett square is a tabular summary of possible combinations of maternal alleles with paternal alleles.[9] These tables can be used to examine the genotypical outcome probabilities of the offspring of a single trait (allele), or when crossing multiple traits from the parents.
The Punnett square is a visual representation of Mendelian inheritance, a fundamental concept in genetics discovered by Gregor Mendel.[10] For multiple traits, using the "forked-line method" is typically much easier than the Punnett square. Phenotypes may be predicted with at least better-than-chance accuracy using a Punnett square, but the phenotype that may appear in the presence of a given genotype can in some instances be influenced by many other factors, as when polygenic inheritance and/or epigenetics are at work.
- ^ Cite error: The named reference
Mendel_1866_1was invoked but never defined (see the help page). - ^ Cite error: The named reference
Mendel_1866_2was invoked but never defined (see the help page). - ^ Cite error: The named reference
Punnett_1907was invoked but never defined (see the help page). - ^ Cite error: The named reference
Edwards_2012_1was invoked but never defined (see the help page). - ^ Cite error: The named reference
Edwards_2012_2was invoked but never defined (see the help page). - ^ Cite error: The named reference
Wimsatt_2012was invoked but never defined (see the help page). - ^ Cite error: The named reference
Edwards_2016was invoked but never defined (see the help page). - ^ Cite error: The named reference
Müller-Wille-Parolini_2020was invoked but never defined (see the help page). - ^ Cite error: The named reference
Griffiths-Miller-Suzuki-Lewontin-Gelbart_2000was invoked but never defined (see the help page). - ^ Basu, Arkatappa. ""The Hindu ePaper | Daily News and Current Affairs"". epaper.thehindu.com. No. 1 April 2024. The Hindu. Archived from the original on 2024-03-13. Retrieved 2024-04-01.