Template:Annotated image/Extinction

CambrianOrdovicianSilurianDevonianCarboniferousPermianTriassicJurassicCretaceousPaleogeneNeogene
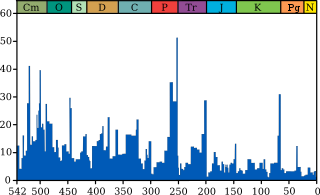
Marine extinction intensity during Phanerozoic
%
Millions of years ago
CambrianOrdovicianSilurianDevonianCarboniferousPermianTriassicJurassicCretaceousPaleogeneNeogene
The blue graph shows the apparent percentage (not the absolute number) of marine animal genera becoming extinct during any given time interval. It does not represent all marine species, just those that are readily fossilized. The labels of the traditional "Big Five" extinction events and the more recently recognised Capitanian mass extinction event are clickable links; see Extinction event for more details. (source and image info)