| This template uses Lua: |
| This template uses TemplateStyles: |
Example
[edit]|
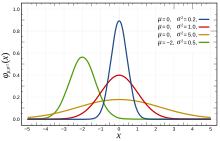
Probability density function  The red curve is the standard normal distribution | |||
|
Cumulative distribution function  | |||
| Notation | |||
|---|---|---|---|
| Parameters |
= mean (location) = variance (squared scale) | ||
| Support | |||
| CDF | |||
| Quantile | |||
| Mean | |||
| Median | |||
| Mode | |||
| Variance | |||
| MAD | |||
| Skewness | |||
| Excess kurtosis | |||
| Entropy | |||
| MGF | |||
| CF | |||
| Fisher information |
| ||
| Kullback–Leibler divergence | |||
Usage
[edit]The Template:Infobox probability distribution generates a right-hand side infobox, based on the specified parameters. To use this template, copy the following code in your article and fill in as appropriate:
{{Infobox probability distribution
| name       =
| type       =
| pdf_image  =
| cdf_image  =
| notation   =
| parameters =
| support    =
| pdf        =
| cdf        =
| quantile   =
| mean       =
| median     =
| mode       =
| variance   =
| mad        =
| skewness   =
| kurtosis   =
| entropy    =
| cross_entropy =
| mgf        =
| cf         =
| pgf        =
| fisher     =
| moments    =
| KLdiv      =
| JSDiv      =
}}
Parameters
[edit]|name=— Name at the top of the infobox; should be the name of the distribution without the word "distribution" in it, e.g. "Normal", "Exponential" (optional)|type=— possible values are "discrete" (or "mass"), "continuous" (or "density"), and "multivariate"|pdf_image=— probability density image-spec, such as:xxx.svg.|pdf_caption=— probability density image caption|pdf_image_alt=— alternative text for the image in|pdf_image=|cdf_image=— cumulative distribution image-spec, such as:yyy.svg.|cdf_caption=— cumulative distribution image caption|cdf_image_alt=— alternative text for the image in|cdf_image=|notation=— typical designation for this distribution, for example . The notation should include all the distribution parameters explained in the next cell.|parameters=— parameters of the distribution family (such as μ and σ2 for the normal distribution).|support=— the support of the distribution, which may depend on the parameters. Specify this as<math>x \in some set</math>for continuous distributions, and as<math>k \in some set</math>for discrete distributions.|pdf=— probability density function (or probability mass function), such as:<math>\frac{\Gamma(r+k)}{k!\Gamma(r)}p^r(1-p)^k</math>. Please exclude the function label, such as "ƒ(x; μ,σ2)".|cdf=— cumulative distribution function, e.g.:<math>I_p(r,k+1)\text{ where }I_p(x,y)</math> is the [[regularized incomplete beta function]].|quantile=— quantile function (or inverse cumulative distribution function). If is the CDF and is the quantile function, then|mean=— the mean, or expected value.|median=— the median, only for univariate distributions.|mode=— the mode.|variance=— variance of the distribution, or covariance matrix in multivariate case.|mad=— the mean absolute deviation around the mean.|skewness=— the skewness.|kurtosis=— the kurtosis excess.|entropy=— the differential information entropy, preferably expressed in unspecified units using base-unspecific log(.) rather than base-specific ln(.) which yields entropy in units of nats only.|cross_entropy=— the cross-entropy of the model|mgf=— the moment-generating function, for example:<math>\left(\frac{p}{1-(1-p) e^t}\right)^r</math>.|char=/|cf=— the characteristic function, such as:<math>\left(\frac{p}{1-(1-p) e^{it}}\right)^r</math>.|pgf=- the Probability-generating function.|fisher=— the Fisher information matrix for the model.|KLDiv=— the Kullback-Leibler divergence of the model|JSDiv=— the Jensen-Shannon divergence of the model|moments=— formulas to use in Method of moments for the model.|ES=— the Expected shortfall or CVaR for the model.|bPOE=— the Buffered Probability of Exceedance for the model.|intro=— optional message which will be displayed before all other content in the infobox.|marginleft=— margin space left of infobox (default: 1em).|box_width=— width of the infobox (default: 325px).
|parameters2=, |support2=, |pdf2=, |cdf2=, |mean2=, |median2=, |mode2=, |variance2=, |mad=, |skewness2=, |kurtosis2=, |entropy2=, |mgf2=, |char2=/|cf2=, |moments2=, |fisher2= are the same as their counterparts above. They should be used when the distribution needs two sets to describe it, e.g. Gamma distribution.


![{\displaystyle {\frac {1}{2}}\left[1+\operatorname {erf} \left({\frac {x-\mu }{\sigma {\sqrt {2}}}}\right)\right]}](https://wikimedia.org/api/rest_v1/media/math/render/svg/187f33664b79492eedf4406c66d67f9fe5f524ea)


