Timeline of the 2000s United States housing bubble

Cost of housing by State
Housing prices to personal income ratios by metro area
  Denver
  Boston
  United States average
  Dallas
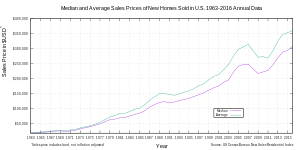
A graph showing the median and average sales prices of new homes sold in the United States between 1963 and 2016.[1]

Housing prices peaked in early 2005, began declining in 2006 (see also United States housing market correction).

  1. ^ "Median and Average Sales Prices of New Homes Sold in United States" (PDF). Census.gov. Retrieved 2014-05-30.