| Timeline of the 2018 Atlantic hurricane season | |||||
|---|---|---|---|---|---|
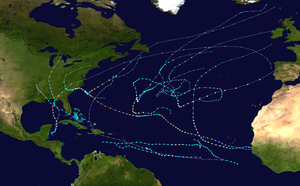
 Season summary map | |||||
| Season boundaries | |||||
| First system formed | May 25, 2018 | ||||
| Last system dissipated | October 31, 2018 | ||||
| Strongest system | |||||
| Name | Michael | ||||
| Maximum winds | 160 mph (260 km/h) (1-minute sustained) | ||||
| Lowest pressure | 919 mbar (hPa; 27.14 inHg) | ||||
| Longest lasting system | |||||
| Name | Florence | ||||
| Duration | 17.75 days | ||||
| |||||
The 2018 Atlantic hurricane season was an event in the annual hurricane season in the north Atlantic Ocean. It was an above-average season for tropical cyclones for the third consecutive year. Though the season officially began on June 1, 2018 and ended November 30, 2018, dates adopted by convention and historically describe the period during each year when most tropical cyclones form,[1] it effectively started with the formation of Tropical Storm Alberto on May 25.[2] The season's final storm, Hurricane Oscar, dissipated on October 31.[3]
The year produced sixteen tropical depressions, all but one of which further intensified into named tropical storms. Of the fifteen named storms, eight developed into hurricanes, and two further intensified into major hurricanes, which are rated Category 3 or higher on the Saffir–Simpson scale. These two major hurricanes contributed to a majority of the season's severe destruction and loss of life, mainly in the United States.
Hurricane Florence formed near Cabo Verde on August 31, steered toward the west-northwest with little exception by a large area of high pressure to its north. The cyclone strengthened amid favorable environmental factors, becoming a Category 4 hurricane with maximum sustained winds of 150 mph (240 km/h) at its peak, but weakening occurred before Florence struck the coastline of North Carolina near Wrightsville Beach on September 14, with winds of 90 mph (140 km/h). Florence dealt a devastating blow to the Carolinas as it meandered across the region. Catastrophic, record-breaking flooding contributed to a majority of the storm's $24 billion in damage and 52 deaths, though significant storm surge along the coastline as well as an inland tornado outbreak caused severe damage as well.[4] In early October, Hurricane Michael formed in the western Caribbean Sea, resulting in significant flooding across Central America and Cuba. However, the majority of the storm's impact was felt in the Florida Panhandle, where Michael struck the coastline near Mexico Beach as a Category 5 hurricane, with winds of 160 mph (260 km/h). This constituted the first landfall of a Category 5 hurricane in the United States since Hurricane Andrew in 1992, and only the fifth in recorded history, alongside "Labor Day", Camille, and "Okeechobee". In addition, Michael became the third deepest by atmospheric pressure, the fourth strongest by maximum winds, and the latest Category 5 hurricane to strike the United States on record. Michael killed 74 people and caused $25 billion in damage.[5]
This timeline documents tropical cyclone formations, strengthening, weakening, landfalls, extratropical transitions, and dissipations during the season. It includes information that was not released throughout the season, meaning that data from post-storm reviews by the National Hurricane Center, such as a storm that was not initially warned upon, has been included.
By convention, meteorologists use one time zone when issuing forecasts and making observations: Coordinated Universal Time (UTC), and also use the 24-hour clock (where 00:00 = midnight UTC).[6] The National Hurricane Center uses both UTC and the time zone where the center of the tropical cyclone is currently located. The time zones utilized (east to west) prior to 2020 were: Atlantic, Eastern, and Central.[7] In this timeline, all information is listed by UTC first with the respective regional time included in parentheses. Additionally, figures for maximum sustained winds and position estimates are rounded to the nearest 5 units (knots, miles, or kilometers), following the convention used in the National Hurricane Center's products. Direct wind observations are rounded to the nearest whole number. Atmospheric pressures are listed to the nearest millibar and nearest hundredth of an inch of mercury.
- ^ Dorst, Neal (June 1, 2018). "Hurricane Season Information". Frequently Asked Questions About Hurricanes. Miami, Florida: NOAA Atlantic Oceanographic and Meteorological Laboratory. Retrieved June 29, 2020.
- ^ Berg, Robbie (October 18, 2018). Tropical Cyclone Report: Tropical Storm Alberto (PDF) (Report). Miami, Florida: National Hurricane Center. Retrieved April 19, 2019.
- ^ Brown, Daniel (February 19, 2019). Tropical Cyclone Report: Hurricane Oscar (PDF) (Report). Miami, Florida: National Hurricane Center. Retrieved May 5, 2019.
- ^ Stewart, Stacy; Berg, Robbie (May 3, 2019). Tropical Cyclone Report: Hurricane Florence (PDF) (Report). Miami, Florida: National Hurricane Center. Retrieved May 3, 2019.
- ^ Beven, John; Berg, Robbie; Hagen, Andrew (April 19, 2019). Tropical Cyclone Report: Hurricane Michael (PDF) (Report). Miami, Florida: National Hurricane Center. Retrieved May 5, 2019.
- ^ "Understanding the Date/Time Stamps". Miami, Florida: NOAA National Hurricane Center. Retrieved July 10, 2020.
- ^ "Update on National Hurricane Center Products and Services for 2020" (PDF). Miami, Florida: National Hurricane Center. April 20, 2020. Retrieved May 17, 2020.