| Timeline of the 2021 Atlantic hurricane season | |||||
|---|---|---|---|---|---|
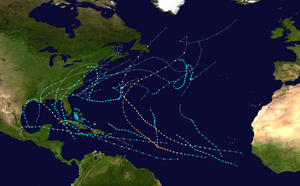
 Season summary map | |||||
| Season boundaries | |||||
| First system formed | May 22, 2021 | ||||
| Last system dissipated | November 7, 2021 | ||||
| Strongest system | |||||
| Name | Sam | ||||
| Maximum winds | 155 mph (250 km/h) (1-minute sustained) | ||||
| Lowest pressure | 927 mbar (hPa; 27.37 inHg) | ||||
| Longest lasting system | |||||
| Name | Sam | ||||
| Duration | 12.5 days | ||||
| |||||
The 2021 Atlantic hurricane season was the third most active Atlantic hurricane season on record with 21 named storms, and the sixth consecutive year in which there was above-average tropical cyclone activity[nb 1][2] The season officially began on June 1, 2021, and ended on November 30, 2021. These dates, adopted by convention, historically describe the period in each year when most Northern Atlantic tropical cyclones form.[3] However, tropical cyclone formation is possible at any time of the year, as was the case this season, when Tropical Storm Ana formed on May 22. The season's final system, Tropical Storm Wanda, dissipated on November 7. Of the season's 21 named storms, seven became hurricanes, and four further intensified into major hurricanes.[nb 2][5] The season's most devastating storm was Hurricane Ida. It made landfall in Louisiana with maximum sustained winds of 150 mph (240 km/h), destroying coastal communities in its path; parts of the New Orleans metropolitan area were left without power for several weeks.[6] The storm caused an estimated $75 billion (2021 USD) in damages in the U.S. and it was responsible for 87 deaths.[7] Over half of those deaths occurred in New York and New Jersey, as the hurricane's remnants brought rains that triggered widespread flooding throughout that region.[6] Additionally, heavy rains caused widespread flooding and landslides across Venezuela as Ida's precursor tropical wave passed though the southeastern Caribbean Sea, resulting in at least 20 deaths.[8] In April 2022, the name Ida was retired from reuse in the North Atlantic by the World Meteorological Organization due to the extraordinary amount of damage and number of fatalities it caused.[9]
This timeline documents tropical cyclone formations, strengthening, weakening, landfalls, extratropical transitions, and dissipations during the season. It includes information that was not released throughout the season, meaning that data from post-storm reviews by the National Hurricane Center, such as a storm that was not initially warned upon, has been included.
By convention, meteorologists use one time zone when issuing forecasts and making observations: Coordinated Universal Time (UTC), and also use the 24-hour clock (where 00:00 = midnight UTC).[10] The National Hurricane Center uses both UTC and the time zone where the center of the tropical cyclone is currently located. The time zones utilized (east to west) are: Greenwich, Cape Verde, Atlantic, Eastern, and Central.[11] In this timeline, all information is listed by UTC first, with the respective regional time zone included in parentheses. Additionally, figures for maximum sustained winds and position estimates are rounded to the nearest 5 units (knots, miles, or kilometers), following National Hurricane Center practice. Direct wind observations are rounded to the nearest whole number. Atmospheric pressures are listed to the nearest millibar and nearest hundredth of an inch of mercury.
- ^ "Background Information: North Atlantic Hurricane Season". College Park, Maryland: NOAA Climate Prediction Center. Archived from the original on May 1, 2021. Retrieved September 19, 2021.
- ^ Rice, Doyle (November 30, 2021). "Lots of storms but a slow finish: Busy 2021 Atlantic hurricane season ends today". USA Today. Archived from the original on November 30, 2021. Retrieved November 30, 2021.
- ^ "Hurricane Season Information". Frequently Asked Questions About Hurricanes. Miami, Florida: NOAA Atlantic Oceanographic and Meteorological Laboratory. June 1, 2018. Archived from the original on July 4, 2024. Retrieved April 13, 2021.
- ^ "Saffir-Simpson Hurricane Wind Scale". Miami, Florida: National Hurricane Center. Archived from the original on June 20, 2020. Retrieved September 14, 2021.
- ^ Masters, Jeff (November 30, 2021). "Top-10 weirdest things about the bonkers 2021 Atlantic hurricane season". New Haven, Connecticut: Yale Climate Connections. Archived from the original on June 1, 2022. Retrieved November 30, 2021.
- ^ a b Reimann, Nicholas (September 18, 2021). "Tropical Storm Odette Swirls Off East Coast With Peter's Formation Imminent As Hurricane Season Shows No Signs Of Slowing". Forbes. Archived from the original on September 18, 2021. Retrieved September 18, 2021.
- ^ "Billion-Dollar Weather and Climate Disasters: Events". Asheville, North Carolina: National Centers for Environmental Information. Archived from the original on January 11, 2022. Retrieved January 10, 2022.
- ^ DREF Plan of Action – Venezuela: Floods (PDF) (Report). International Federation of the Red Cross and Red Crescent Societies. September 2, 2021. Archived (PDF) from the original on September 4, 2021. Retrieved October 8, 2021 – via ReliefWeb.
- ^ "Hurricane Committee retires Ida, prepares for 2022 season". Geneva, Switzerland: World Meteorological Organization. April 27, 2022. Archived from the original on January 21, 2024. Retrieved April 28, 2022.
- ^ "Understanding the Date/Time Stamps". Miami, Florida: NOAA National Hurricane Center. Archived from the original on April 12, 2021. Retrieved July 10, 2020.
- ^ "Update on National Hurricane Center Products and Services for 2020" (PDF). Miami, Florida: National Hurricane Center. April 20, 2020. Archived (PDF) from the original on August 27, 2021. Retrieved May 17, 2020.
Cite error: There are <ref group=nb> tags on this page, but the references will not show without a {{reflist|group=nb}} template (see the help page).