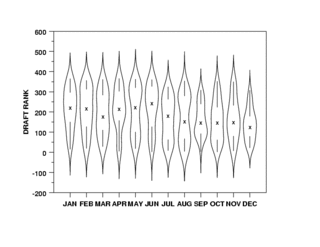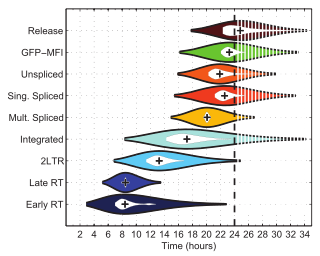

A violin plot is a statistical graphic for comparing probability distributions. It is similar to a box plot, with the addition of a rotated kernel density plot on each side.[1]
- ^ "Violin Plot". NIST DataPlot. National Institute of Standards and Technology. 2015-10-13.