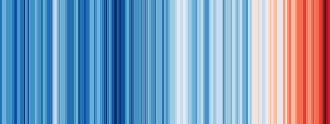
Warming stripes (sometimes referred to as climate stripes,[3][4][5][Note 1] climate timelines[6] or stripe graphics[7]) are data visualization graphics that use a series of coloured stripes chronologically ordered to visually portray long-term temperature trends.[2][Note 2] Warming stripes reflect a "minimalist"[2][5] style, conceived to use colour alone to avoid technical distractions to intuitively convey global warming trends to non-scientists.[8][9]
The initial concept of visualizing historical temperature data has been extended to involve animation,[10] to visualize sea level rise[11] and predictive climate data,[12] and to visually juxtapose temperature trends with other data such as atmospheric CO2 concentration,[13] global glacier retreat,[14] precipitation,[4] progression of ocean depths,[15] aviation emission's percentage contribution to global warming,[16] biodiversity loss,[17] soil moisture deviations,[18] and fine particulate matter concentrations.[19] In less technical contexts, the graphics have been embraced by climate activists, used as cover images of books and magazines, used in fashion design, projected onto natural landmarks, and used on athletic team uniforms, music festival stages, and public infrastructure.[20]
- ^ Cite error: The named reference
ClimateLabBookWMO_20181204was invoked but never defined (see the help page). - ^ a b c Cite error: The named reference
Gizmodo_20190617was invoked but never defined (see the help page). - ^ Cite error: The named reference
WashPost_20190621was invoked but never defined (see the help page). - ^ a b Cite error: The named reference
NOAAclimate_20190628was invoked but never defined (see the help page). - ^ a b Cite error: The named reference
Potsdam_20190927was invoked but never defined (see the help page). - ^ Cite error: The named reference
NCAS_2018was invoked but never defined (see the help page). - ^ Cite error: The named reference
ClimateReality_20190621was invoked but never defined (see the help page). - ^ Cite error: The named reference
Gizmodo_20180525was invoked but never defined (see the help page). - ^ Cite error: The named reference
ScienceAlert_20180525was invoked but never defined (see the help page). - ^ Cite error: The named reference
Vox_20190530was invoked but never defined (see the help page). - ^ Cite error: The named reference
RSJones_20190708was invoked but never defined (see the help page). - ^ Cite error: The named reference
Gizmodo_20190320was invoked but never defined (see the help page). - ^ Cite error: The named reference
Bevacqua_201811was invoked but never defined (see the help page). - ^ Cite error: The named reference
RSJones_20190701was invoked but never defined (see the help page). - ^ Cite error: The named reference
OceanCoastalMgt_20210523was invoked but never defined (see the help page). - ^ Cite error: The named reference
IOPhysics_20211104was invoked but never defined (see the help page). - ^ Cite error: The named reference
BiodiversityStripes_20230400was invoked but never defined (see the help page). - ^ Cite error: The named reference
DWD_SoilMoisture_202310was invoked but never defined (see the help page). - ^ Cite error: The named reference
AirQualityStripes_202408was invoked but never defined (see the help page). - ^ Cite error: The named reference
BBC_20231210was invoked but never defined (see the help page).
Cite error: There are <ref group=Note> tags on this page, but the references will not show without a {{reflist|group=Note}} template (see the help page).