Wikipedia biographies in the 20th century
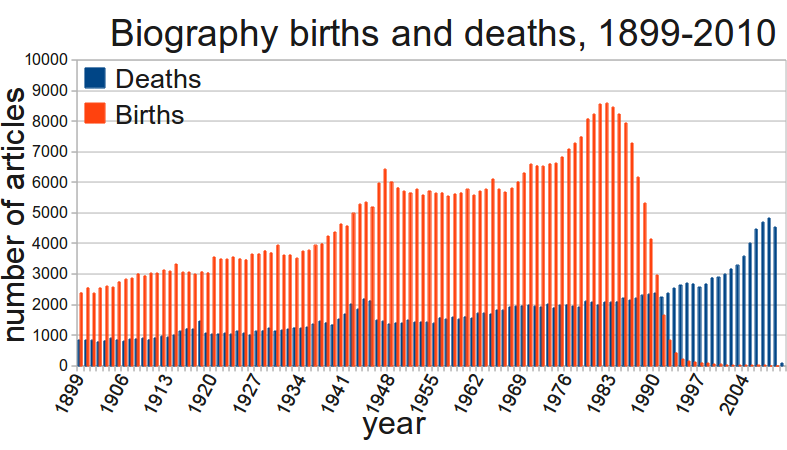
How are Wikipedia biography articles distributed in the 20th century? The following graph shows the number of births and deaths of people with Wikipedia articles for each year of the 20th century (1899 until 2010, actually) based on the birth year and death year categories.
What the data seem to show is that the number of births remains relatively steady (with a slow increase) until about 1935, and then (presumably) the effect of recentism and the large number of biographies of living people starts to kick in, and the number of people with Wikipedia articles born in the years after that point increases, with a spike in 1947 (from the post-war baby boom, perhaps?). Then it levels off and starts to rise dramatically from about 1970 onwards (this would be people who are about 40 years old), reaching a peak with people born in 1982 (28 years old). The figures collapse completely around 1990 when the age drops low enough that the subjects of the biographies are children, forming a tailing off that never completely disappears and only reaches zero in 2010 (no-one automatically notable has been born yet).
For deaths, there is a slow but steady increase from 1899 to about 1990, with two peaks that are clearly due to the two World Wars (the peaks are in 1918 and 1944). There is a massive increase in deaths between 1990 and 2009, with the peak in the last three years with all those years being over 4,500. The actual peak is 4825 deaths in 2008. The births peak in 1982 was 8577 for comparison. The deaths graph drops off dramatically at the end, because "only" 82 people with Wikipedia articles have died this year so far (though rather disconcertingly I see that has gone up to 98 in the space of a single day - the figures I have were taken on 11/01/2010). Or to put that another way: over the past three years, an average of 12 to 13 people with Wikipedia articles have died each day.
Trying to measure how fast people are "born" (i.e. appear on Wikipedia) is not so easy to calculate, as people have to become "notable" first, and they do that at different rates (some are notable when they are born, others take a bit longer, maybe not becoming notable until after they have died). As to the peak of births in 1982 and the decline after that, it is difficult to explain why that year, precisely, is the peak; probably several factors are at work there.


Discuss this story
— V = I * R (talk to Ohms law) 09:39, 28 January 2010 (UTC)[reply]
Someone asked how many of these biographies get created because of media attention around their death, so I took it upon myself to look at article creation on dead people directly after their death. A look at deaths in January 2009 shows 13.26 deaths a day, which corresponds quite well with the above numbers.
I then looked at the month from 29 December 2009 till 28 January 2010 (I excluded 12 January, because of the extraordinary high death tolls from the Haiti earthquake – 32). This gave me an average of 12.76 a day, which is not too far below the number from January last year. However, this contains some red links, and these get deleted after one month (the ones from 28 December have already been culled). Of my sample, 2.83 were red links. That leaves 9.93 live links per day; 3.33 less than the average from last year. So accordingly, 3–4 biographies on dead people – a day – will have to be created over the next year to get to the normal level. I’ll try to also put up a graph of how the blue-to-red ratio moves over the course of the month. Lampman (talk) 06:48, 29 January 2010 (UTC)[reply]